
Looker Studio is an incredibly powerful tool for visualizing and analyzing your GA4 data.
However, some essential metrics, like Average engagement time, are not natively available in Looker Studio and this metric is crucial for understanding how long visitors actively engage with your site.
The good news? You can easily create this metric in Looker Studio using calculated fields.
In this guide, we’ll walk you through the simple steps to calculate and format Average engagement time so you can track an active user engagement more effectively.
If you’d rather watch than read, check out the tutorial below for a step-by-step walkthrough:
Why is average engagement time important?
Before we dive into the setup, let’s briefly discuss why this metric is essential.
Average engagement time gives you insights into how long users are actively engaging with your site rather than just passively leaving the page open (for this you can use the Average session duration metric).
This can help you:
- Measure the quality of your traffic
- Evaluate content effectiveness
- Optimize pages for better user interaction
Since this metric isn’t available by default in Looker Studio, let’s create it using a calculated field.
Step 1: Create a calculated field
To build the Average engagement time metric, follow these steps:
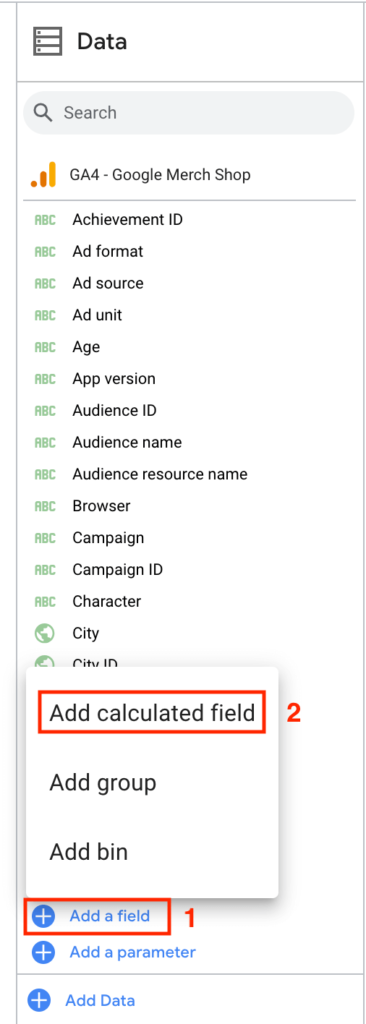
1. Click ‘Add a field‘ and then select ‘Add calculated field‘
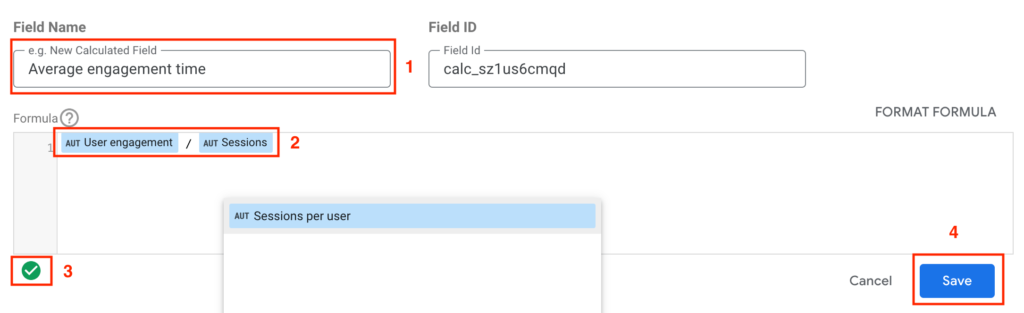
2. In the pop-up window, give it a name like “Average engagement time“
3. In the formula field, type in the following formula: User engagement / Sessions (alternatively, you can divide it by Active users instead of Sessions if that suits your analysis better)
4. If you see a green checkmark, it means the formula is correct
5. Click ‘Save‘ and then ‘Done‘
Step 2: Adjust the field type to “Duration”
By default, Looker Studio treats the calculated field as a numeric value.
However, since GA4 presents Average engagement time in a time format (e.g., 2 minutes 50 seconds), we need to adjust the field type.
Here’s how:
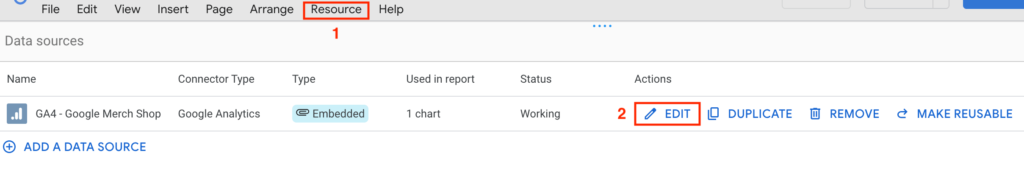
1. Click ‘Resource‘ > ‘Manage added data sources‘
2. Select the data source you’re working with and click ‘Edit‘
3. Locate your newly created Average engagement time field and notice that it is currently set to ‘Number‘
4. Click the numeric field type and select ‘Duration‘
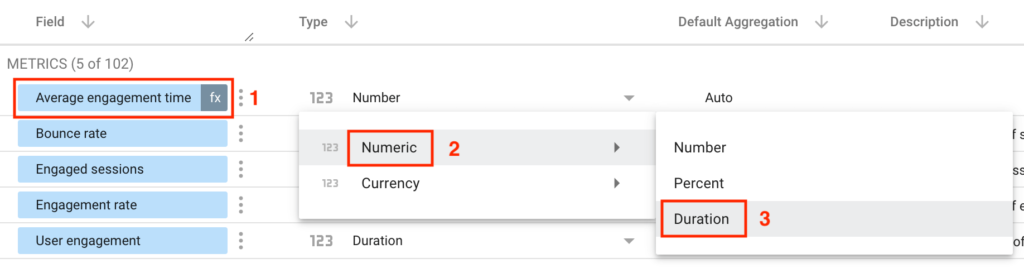
5. Click ‘Done‘ and then ‘Close‘
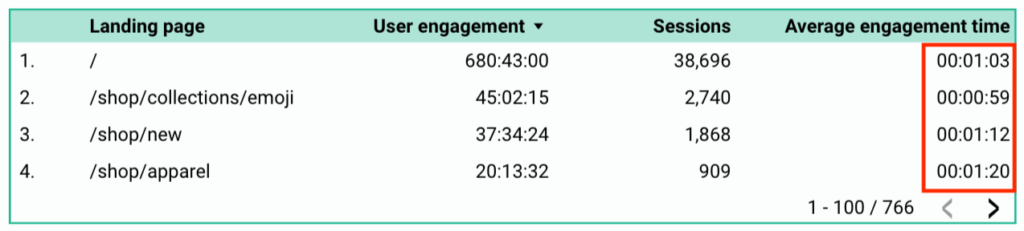
Now, your Average engagement time metric will display in the correct time format, just like it appears in GA4.
Final checks and adjustments
To ensure everything works as expected:
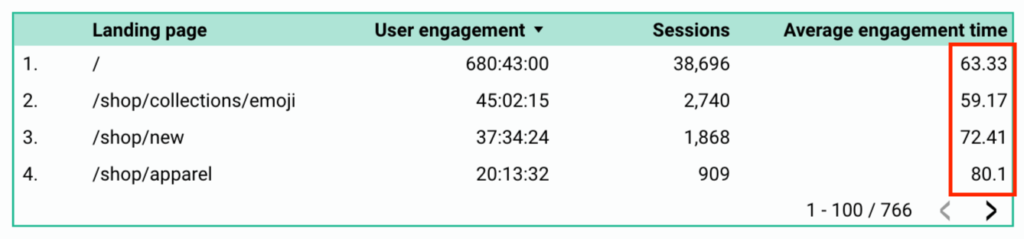
- Go back to your table or chart and check if the metric appears correctly.
- If needed, edit the name or formula by clicking on the field and making adjustments.
- Your changes will automatically reflect in your reports.
Conclusion
And that’s it! You’ve successfully created a custom Average engagement time metric in Looker Studio.
Now you can analyze user engagement more effectively and gain better insights into how visitors interact with your site.
If you found this tutorial helpful, stay tuned for more Looker Studio and GA4 tips.